…

Tenant Satisfaction Measures

82.9%

Overall satisfaction with the service provided by us

86.6%

Satisfied the home we provide is well maintained

91.3%

Treated fairly and with respect

91.1%

Satisfaction with repairs service

Tenant Satisfaction Measures (TSMs) 2025/26

The Regulator of Social Housing in England introduced Tenant Satisfaction Measures (TSMs) to assess how well landlords are performing in providing safe, good-quality homes and services.

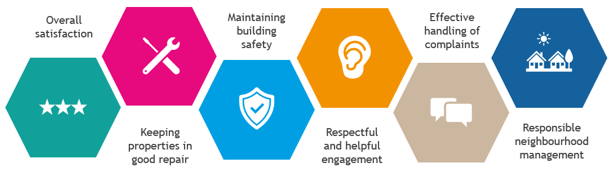
The five key themes measured are:

  1. Keeping properties in good repair
  2. Maintaining building safety
  3. Respectful and helpful engagement
  4. Effective complaint handling
  5. Responsible neighbourhood management

There are 22 measures in total:

  • 12 from tenant satisfaction surveys
  • 10 from internal performance data

These measures help ensure housing providers remain accountable and continuously improve services.

We have continued to monitor performance over time to understand what matters most to tenants and to shape our service improvement plans.

For 2025/26, our results show:

✅ Strong overall performance across all areas

✅ All 12 perception measures in the top quartile

Continued improvement in key services such as repairs, communication, and engagement

We will continue to benchmark our performance against other landlords and track trends year on year.

We run perception surveys throughout the year in three waves:

  • July 2025
  • November 2025
  • March 2026

These surveys are carried out independently by MEL Research.

Tenant feedback:

  • Helps shape improvement plans
  • Influences decision-making
  • Ensures transparency in our performance

Your views matter — and we act on them.

By completing the survey we gather your replies from the Tenant Satisfaction Measures alongside additional measures which help us gain information on areas that we think are important.

Before the TSMs framework was introduced, we were already conducting regular customer surveys and therefore it has always been important for Nehemiah Housing to hear how we’re performing from our tenants perspective.

Who takes part?

The 2025/26 results are based on:

  • 357 completed surveys
  • A 29% response rate
  • Meets regulatory requirements for statistical accuracy

Participants are randomly selected to ensure a fair representation across:

  • Age
  • Ethnicity
  • Disability
  • Gender
  • Other backgrounds

When?

Fieldwork took place across:

  • July 2025
  • November 2025
  • March 2026

We review results regularly and carry out quarterly deep dives to identify areas for improvement.

How?

Feedback is collected through telephone and online surveys carried out by MEL Research . Read more about how this was done by downloading Our Approach Document

What?

We ask a set of questions set out by the regulator, which have to be asked a specific order and use specific wording to enabling comparison to other landlords. The regulator’s guidance is here.

The questions asked by MEL Research would align to the regulator’s guidelines

For more information on the Tenant Satisfaction Measures and how they affect you, please visit Tenant Satisfaction Measures – Summary of RSH requirements (acce

The results below show our performance for April 2025 – March 2026.

Overall Satisfaction

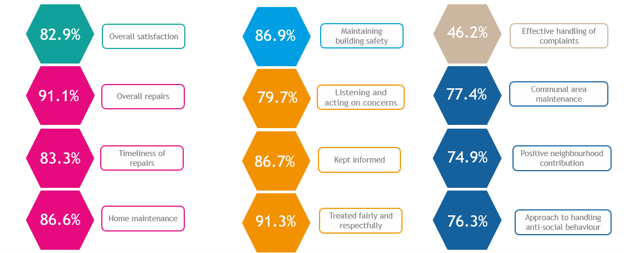
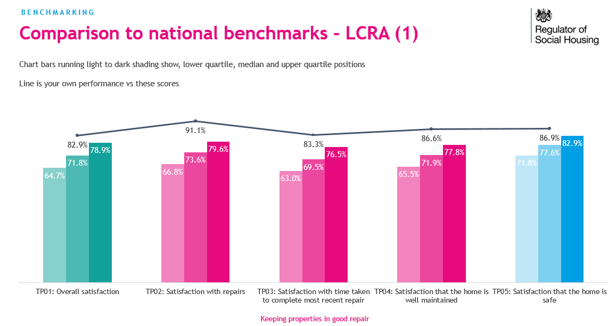
  • 82.9% satisfied with the overall service (↑ from 77.7%)

✅ Keeping Properties in Good Repair

  • Satisfaction with repairs: 91.1% (↑ from 79.1%)
  • Satisfaction with repair times: 83.3% (↑ from 73.3%)
  • Homes well maintained: 86.6% (↑ from 78.6%)

What this means

Repairs and maintenance are now one of our strongest performing areas and a key driver of overall satisfaction.

Improvements made

  • Continued investment in property maintenance
  • Focus on damp and mould response
  • Improved contractor performance and oversight
  • Whole-system upgrade approach to major repairs

Decent Safe Homes

A decent home is warm, weatherproof and in a reasonable state of repair. In 2025/26, none of our homes failed the Government’s Decent Homes Standard – 0.0%, the same as last year and better than the sector average of 0.5%.

Put simply, every Nehemiah home met the standard.

Maintaining Building Safety

  • Satisfaction that home is safe: 86.9% (↑ from 82.3%)
  • Safety checks (gas, fire, water, asbestos, lifts): 100% compliant

Your safety is our priority

We continue to ensure:

  • All statutory safety checks are completed on time
  • Investment is made in long-term building safety improvements

Repairs On Time

Faster Repairs Above the Sector

  • When something needs fixing, we aim to put it right quickly within 24 hours for emergencies and within our routine target of 14 days for non-emergency repairs.
  • This year we completed 97.5% of emergency repairs and 95.9% of routine repairs on time.

Both improved on last year and sit comfortably above the sector averages of 94.9% and
82.5%.

✅ Respectful and Helpful Engagement

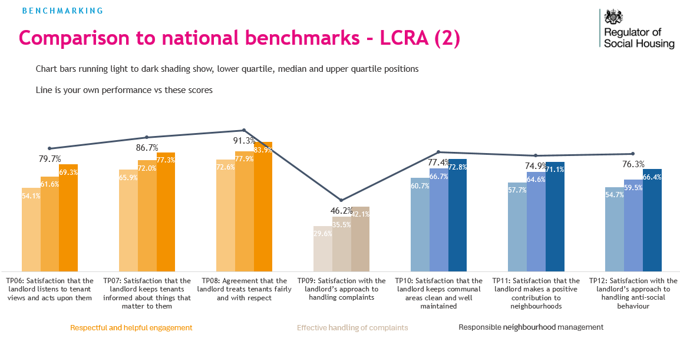
  • Treated fairly and with respect: 91.3% (↑ from 87.5%)
  • Kept informed: 86.7% (↑ from 85.3%)
  • Listened to and acted upon:79.7% (↑ from 72.1%)

What this means

Tenant engagement has significantly improved, with more residents feeling heard and informed.

Improvements made

  • Expanded feedback channels (surveys, meetings, digital communication)
  • Strengthened “You Said, We Did” communication
  • Increased tenant involvement in shaping services
  • Improved communication clarity and accessibility

Effective Handling of Complaints

When you complain, you deserve a timely response.

We answered 94.8% of Stage 1 complaints within the Complaint Handling Code timescales – up from 86.5% last year and above the sector average of 89.9%.

Stage 2 responses rose sharply too, from 57.1% to 80.0%.

That is real progress, though still below the sector average of 88.9%, so quicker
Stage 2 responses remain a priority for us.

  • Satisfaction with complaints handling: 46.2% (↑ from 40.7%)

What this means

While performance has improved, complaints handling remains our lowest scoring area and a key priority.

Improvements made

  • Faster response times
  • Clearer communication during complaint investigations
  • Increased focus on early resolution
  • Stronger learning from complaints to improve services
  • More complaints logged and acted on

We also report how many complaints we receive for every 1,000 homes. This year that rose to 63.2 Stage 1 and 8.2 Stage 2 complaints per 1,000 homes, up from 30.1 and 5.7 last year. Our Stage 2 rate is in line with the sector average of 8.3; our Stage 1 rate is above the average of 53.5. Some of this rise reflects making it easier to raise concerns
and recording them more consistently – and we treat every complaint as a chance to put something right.

We are reviewing the themes behind them closely.

Responsible Neighbourhood Management

  • Communal areas clean and well maintained: 77.4% (↑ from 74.1%)
  • Positive contribution to neighbourhoods: 74.9% (↑ from 71%)
  • Handling anti-social behaviour (ASB): 76.3% (↑ from 69.6%)

What this means

Performance remains strong, though slightly lower than other areas — making this a focus for continuous improvement.

Improvements made

  • Improved cleaning and grounds maintenance schedules
  • Regular estate inspections
  • Investment in community initiatives
  • Strengthened partnership working (e.g. police, local authorities)
  • Enhanced ASB response and case management

Anti- Social Behaviour

Fewer Cases Last Year

Everyone has the right to feel safe and settled where they live. We recorded 26.2 anti‑social behaviour cases per 1,000 homes this year – down from 29.2 last year and below the sector average of 36.0. We continue to work closely with residents and partners to resolve cases and support anyone affected.

Hate Related Incidents

Low numbers, closely monitored
As a landlord rooted in serving diverse communities, we take hate‑related incidents extremely seriously. We recorded 2.5 hate‑related cases per 1,000 homes this year, up from none recorded last year. Numbers remain low, but any incident matters to us – we encourage residents to report, and we make sure every report is met with support and appropriate action.

Key Insights: What drives satisfaction?

Our analysis shows overall satisfaction is strongly influenced by:

  • Quality and speed of repairs
  • Well-maintained homes
  • Feeling listened to
  • Effective communication

Summary – 2025/26

82.9% overall satisfaction
All 12 TSM measures in the top quartile
✅ Strong improvements in:

  • Repairs
  • Engagement
  • Communication

⚠️ Priority areas for improvement:

  • Complaints handling
  • Neighbourhood services (ASB, communal areas)

You Said, We Did

  • You told us repairs and communication matter most.
  • ✅ We improved response times, invested in homes, and kept you better informed.
  • You told us you want to be heard.
  • ✅ We expanded engagement channels and showed how feedback drives change.
  • You told us complaints need improving.
  • ✅ We strengthened processes and are continuing to focus on this area

Nehemiah Housing Tenant Satisfaction Measures 2025/26 % who are satisfied/positive
Benchmarking

See how our results compare to other housing associations.
Our management measures – the parts of our service we count and check, from repairs and safety to how we handle complaints. You can download more information here

Tell Us What You Think and Have Your Say

Let us know if you know how we can provide better services or improve how we do things.

Your feedback has shaped initiatives that help tackle key issues and improve how we deliver our services so it is important to have your say.

There are lots of ways to get involved so that together we can create the best possible housing and communities for you our tenants to enjoy.

We will continue to gather TSM data and share it with our tenants on a regular basis to ensure we are transparent about our performance and provide tenants with certainty in the services we deliver.

Marcia Cunnison – Community Partnership & Engagement Officer

If you would like to know more please contact our Community Partnership & Engagement Officer Marcia Cunnison by emailing haveyoursay@nehemiah.co.uk or by calling 0121 358 8030.  

Related content